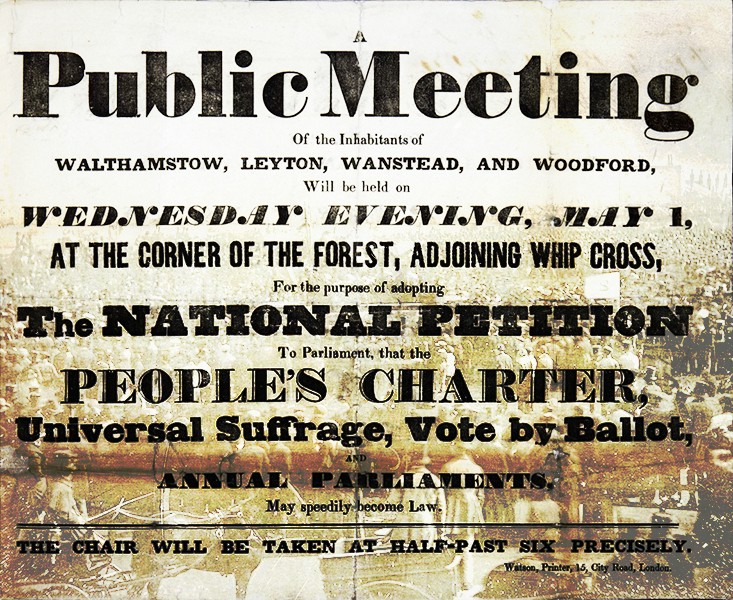
The famous Chartists’ six demands (all but one of which were eventually implemented) are taught in our state schools and throughout Society as if Holy Writ, and normally presented in terms of petitio principia, it being inconceivable that any would question their justice:
• ‘All men to have the vote (universal manhood suffrage)’: Has that really worked out so well, comparing the trainwreck that is 21st Century Britain with 19th or 18th Century Britain, or comparing the past and present state of any European (-descended) country? We throw out votes like confetti, not requiring any knowledge or qualifications or public service—not even citizenship (citizens of 53 countries being allowed to vote in all British elections and referenda even if just passing through) or obedience to our laws.
• ‘Voting should take place by secret ballot’: To protect people from intimidation and prevent bribery, but introduces corruption of its own—as we see in the US with the controversies over electronic voting, and here with postal voting (especially in Muslim areas). Where once we could look around and count the hands (including female hands—yes, some women had the vote before 1918), now it is a matter of (as Stalin said): ‘It’s not the people who vote that count, it’s the people who count the votes’; and our trust in those counting the votes is decreasing—and given that we have just participated in an EU election when we should have left the EU long since, who can blame us?
• ‘Parliamentary elections every year, not once every five years’: The only Chartist demand unimplemented, and with the 2014 referendum (for us Jocks) followed by the 2015 GE then 2016 referendum (UK) plus assembly (Scotland and Wales) and PCC elections (England and Wales), then the 2017 GE—how’s that annual election idea sounding now?
• ‘Constituencies should be of equal size’: The holy grail of equalliiddeeee. This removes links to constituencies, with communities split and bundled together then frequently changed. Further, it increases the political weight of densely populated urban areas—whose residents share broadly the same issues—at the expense of smaller communities who find themselves haphazardly bundled together with other communities with sometimes quite different issues. It results in the Tyranny of the Urbanite, with urban concerns taking precedence over rural and maritime, and ignorant sentimentalities obtaining the force of law and overriding local knowledge and practical experience.
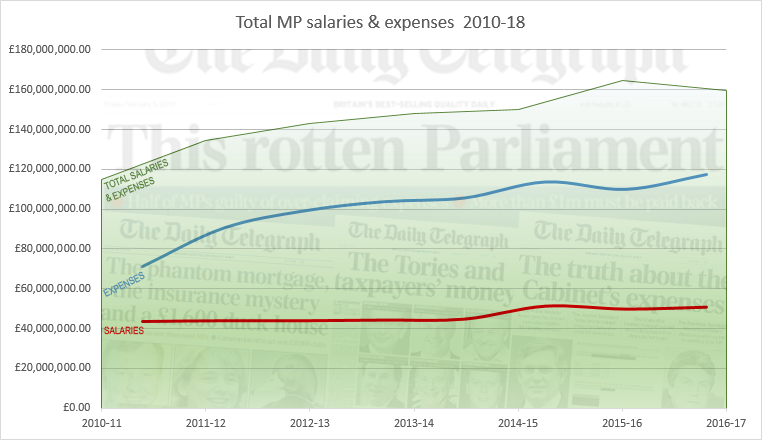
• ‘Members of Parliament should be paid’ & ‘The property qualification for becoming a Member of Parliament should be abolished’. Being unsalaried required MPs to have actual talent, sufficient to at least keep themselves financially afloat—unlike the incompetent and corrupt charlatans, diversity-hires and fifth columnists now infesting our various elected People’s assemblies across the West, awarding themselves pay rises without regard to performance.
Nor did the property requirement and lack of salary restrict MPs to the ranks of the ‘idle rich’, as commonly supposed—e.g. the famous Radical William Cobbett, a former Sergeant Major, was very far from born with a silver spoon in his mouth: he financed himself through his (still famous) writing. Edmund Burke was better off but still a long way from buying his seat at the table, but his innate talent convinced Lord Verney and William Hamilton to offer their patronage. There were also successful naval officers rich from prizes, like Sir Edward Pellew.[1] Many MPs combined Parliamentary careers with military ones, such as John Norris, who combined representing Rye (1708–22, 1734–49) and Portsmouth (1722–34) with a Royal Naval career, commanding operational cruises to the Baltic; and Admiral Thomas Cochrane (the inspiration for C.S. Forester’s Hornblower) who led daring expeditions against Buonaparte’s forces in the Med while representing Westminster (1807–18).[2]
Browsing the MP biographies on the History of Parliament turns up many an MP far from ‘idle’ or ‘rich’ (at least not born so). E.g. William Adam (1751–1839) whose ‘precarious financial situation created by his father’s involvement in his uncle’s speculative building ventures put his political career under constant threat of disruption’. There was John Agnew (1759–1812) and James Alexander (1769–1848) who both made their fortunes in India.[3] There was Matthew Wood (1768–1843), son of a serge maker and ‘at 14 apprenticed to a chemist … five years later he was a wholesale chemist’s traveller’—not at all silver spoon territory. Granted that many others, perhaps most, started off life fairly well set up, but I have yet to find one that could be equated to today’s ‘trust fund babies’ with their ‘snowplough parents’; they all seem to have put in some hard graft, albeit usually in more congenial circumstances than a miner—usually but not always as in the period 1790–1820 ‘more than 400 Members at some stage served in the regular army, including Sir Thomas Picton, killed at Waterloo[, and a] further 100 Members served in the Royal Navy’. Perhaps most notable of these military parliamentarians was an Irishman of no great wealth who represented in turn the constituencies of Rye, Mitchell then Newport (Isle of Wight) from 1806 to 1809, during which period he participated in the Danish campaign before being placed in command of the Peninsular expedition in 1808, his Commons career only ending with his elevation to the Lords: Arthur Wellesley.
For many, being an MP was part-time (and being unpaid, the public little minded them taking long holidays or concentrating on their businesses), MPs once seeing their job as simply steering Plato’s ‘Ship of State’ safely—taking in a reef here, setting full sail there, battening down the hatches and seeking safe harbour when necessary; a steady hand on the tiller rather than a slalom course—and not be forever trying to rebuild the entire ship from the keel up, as our MPs do now, seeking headlines for their latest whim to radically restructure our country.
Since Simon de Montfort summoned the first Parliament at Westminster in 1265 (and from before that, Parliament’s origins lying in the 8th Century Saxon Witan and Moot) until 1911, its members sat without expectation of remuneration—and we had far better MPs when they enjoyed no salaries or expenses than ever since: apart from those already mentioned, there were Canning and Castlereagh, and J.S. Mill, PMs such as Pitt the Younger, Wellington, Peel, Palmerston, Salisbury, etc. Other than Winston, who have we had since that compares to those political titans?
A brief look at the world the Chartists created:
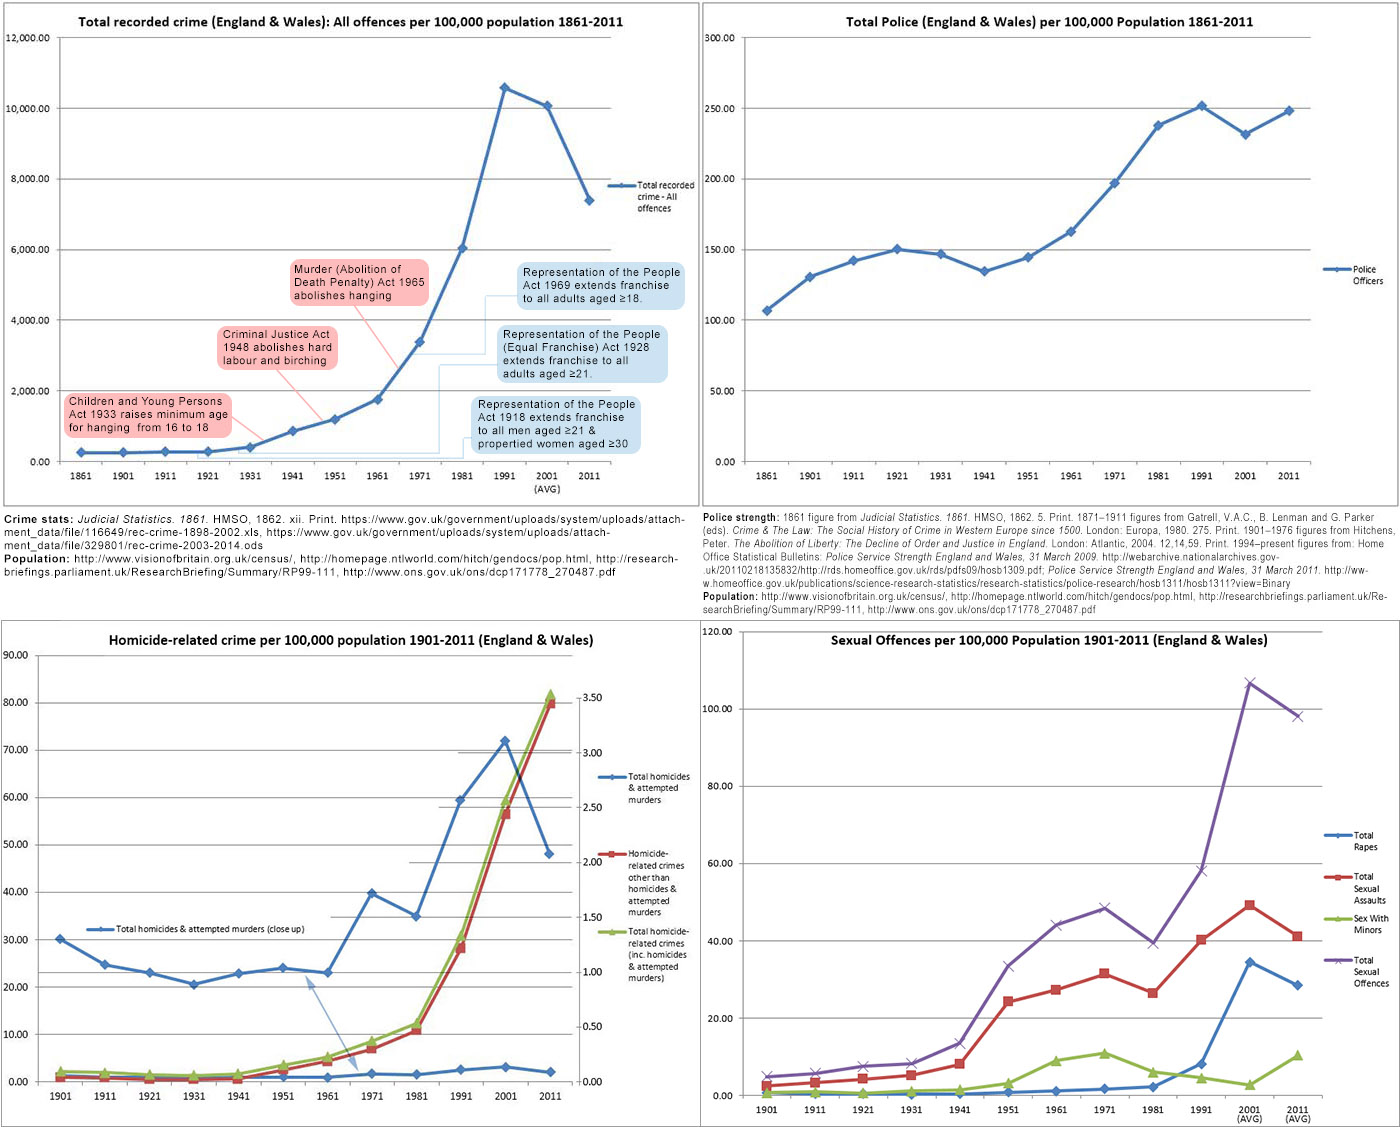
Crime levels are a good measure of how successful a society is, and from 1861 to 1901 (per 100,000 population) total recorded crime in England & Wales decreased 1.7%; in contrast, from 1921 to 2011, it increased 2,614.3%—homicides (our least serious rise) increased 72.74% but all serious violence (from GBH to homicide) increased 5,269.5%; rapes 8,508.72%, and the category of ‘Total Violence Against the Person’ 39,606.88%. (The Left will criticise police cuts but there has never been more police per head of population: from 1921 to 2011 (per 100,000 head), police strength in England & Wales increased 65.07%, and that is without taking into account the hordes of support staff, PCSOs, etc. whose jobs, where they existed at all, were once done by actual policemen.)[5]
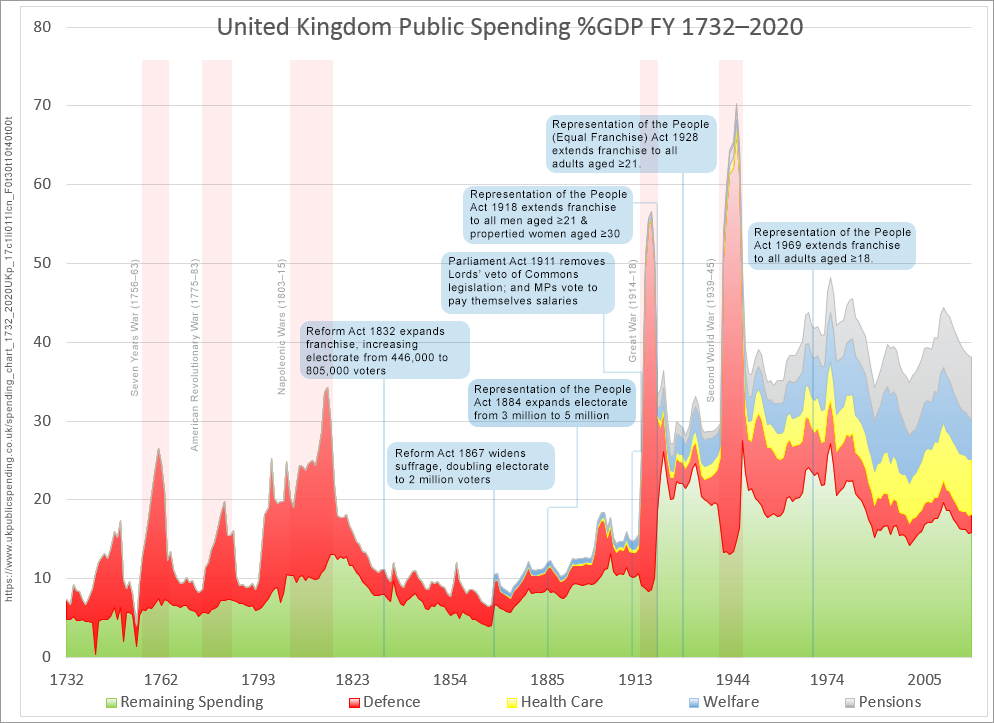
Public spending as a percentage of GDP has long surpassed what it was at the height of the Napoleonic wars when we were fighting for our national survival, and approaches what we were spending in WW1; yet not only are we fighting no major war, spending on defence—a core function of government—is a fraction of everything else. This site records public spending in 1815 as 34.3% of GDP, of which 22.1% was defence; in 1918, public spending reached 56.64% of GDP, of which 47.07% was defence; in 1945, public spending reached no less than 70.34% of GDP, of which 52.01% was defence. In comparison, 2015 saw public spending at 40.86% of GDP, only 2.44% of which was defence.
The mass democracy Chartists demanded delivered not small government but large and ever-expanding government; it has delivered burgeoning crime, while disarming us in the face of those criminal threats; it has delivered not freedom but increasing tyranny—indeed Nineteen Eighty-Four itself; it has swapped Christian faith for liberal delusion; and augers the demise of European civilisation.[6]
In conclusion: The Chartists Did Nothing Right. They promised us Heaven, but delivered only Hell.
Endnotes
[1] Someone familiar to fans of the Hornblower saga, either books or the equally excellent 1998–2003 TV series (played by Robert Lindsay), and who some contend to be the inspiration for Patrick O’Brian’s Jack Aubrey.
[2] Commanding the frigate Imperieuse (38), and not limited to the Med; e.g. capturing the fortress of Mongat, between Gerona and Barcelona in 1808; e.g. commanding an attack on Rochefort (part of the Battle of the Basque Roads) in 1809.
[3] This will cause SJWs to complain about ‘imperialist’ ‘exploitation’, White-Man-Bad, etc.—but at worst they could have been no worse than liberal icons Steve Jobs taking advantage of cheap, unregulated labour in his factories in China and Amazon’s Jeff Bezos’ exploitative work practices.
[4] Data from the Independent Parliamentary Standards Authority. CSV files: salaries: 2010-11, 2011-12, 2012-13, 2013-14, 2014-15, 2015-16, 2016-17, 2017-18; expenses: 2010-11, 2011-12, 2012-13, 2013-14, 2014-15, 2015-16, 2016-17, 2017-18.
[5] Sources for crime statistics:
• Population: Census Reports from the University of Portsmouth’s ‘A Vision of Britain Through Time’, GenDocs (archived), House of Commons Library, ‘A Century of Change: Trends in UK Statistics Since 1900’, Office for National Statistics, ‘2011 Census—Population and Household Estimates for England and Wales’.
• Crime stats: Judicial Statistics. 1861. HMSO, 1862. xii. Official Statistics, Historical crime data, ‘A summary of recorded crime data from 1898 to 2001/02’, ‘Offences recorded by the police in England and Wales by offence and police force area from year ending Mar 2003 to year ending Mar 2015’.
• Police strength: 1861 figure from Judicial Statistics, 5. 1871–1911 figures from Gatrell, V.A.C., B. Lenman and G. Parker (eds). Crime & The Law: The Social History of Crime in Western Europe since 1500. Europa, 1980. 275. 1901–1976 figures from Hitchens, Peter. The Abolition of Liberty: The Decline of Order and Justice in England. Atlantic, 2004. 12,14,59. 1994–present figures from: Home Office Statistical Bulletin: Police Service Strength England and Wales, 23 Jul 2009; Police Service Strength England and Wales, 31 Mar 2011.
[6] The rising tide of Islam:
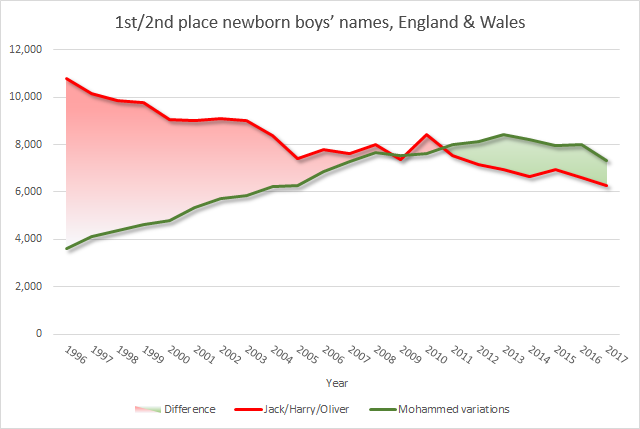
Sourced from the Office of National Statistics. Although complacently declaring that ‘Oliver remained the most popular first name given to baby boys in England and Wales in 2017, a position held since 2013’, this ignores basically identical names spelled differently, especially when coming from languages with different alphabets and from corners of the world where illiteracy is prevalent. Thus, adding all recognisable spelling variants of ‘Mohammed’ (even excluding hyphenated variations of the variant spellings; e.g. 2017 figure counts 9× Mahamed, 3× Mahammed, 30× Mohamad, 269× Mohamed, 837× Mohammad, 1,982× Mohammed, 3× Mohammod, 5× Mohamud, 5× Mohummad, 4× Mohummed, 3× Mouhamad, 4× Mouhamed, 13× Muhamad, 11× Muhamed, 3,691× Muhammad, and 450× Muhammed), shows that ‘Mohammed’ is actually the most popular boys’ name in England & Wales, and has been since 2011 (first reaching the top 10 in 2001 and hitting first place in 2009, but briefly dropping to 2nd in 2010).
